



The primes have a spectrum, and its peaks land on the Riemann zeros: 72 out of 72
I built the prime staircase from a sieve, took its Fourier transform, and checked whether its peaks sit where a separate calculation puts the zeros.
Write out the primes and there is no pattern in them. 2, 3, 5, 7, 11, 13, 17. No formula gives you the next one. They thin out as you go, and roughly how fast they thin out has been known for two centuries, but the actual placement looks like noise laid over that average.
It is not noise. In 1859 Riemann showed that the difference between where the primes actually are and where the smooth average puts them is a sum of waves. Not approximately a sum of waves. Exactly one, with one wave for each zero of a particular function, and the zero’s height setting the wave’s frequency.
“The music of the primes” is the usual phrase for this and I had always assumed it was a figure of speech. It is an equation. I wanted to build both sides of it and watch them meet.
Finding the zeros first
Before anything else I had to have the zeros, and I wanted to compute them rather than look them up.
The function is awkward to evaluate directly in the region that matters. I used an acceleration of a related series instead, and rotated the result. That turns it into a real-valued function whose sign changes mark the zeros. Sign changes are easy to hunt by bisection. Then the gate: the first four heights are standard reference values, and my code had to reproduce all four before I let anything downstream use it. They matched to seven decimal places.
Watching the primes come back out of the waves
The prime staircase goes up by one step at each prime. Riemann’s formula says you can rebuild it from the zeros. So I rebuilt it, using one wave, then ten, then forty, then all eighty-eight I had.
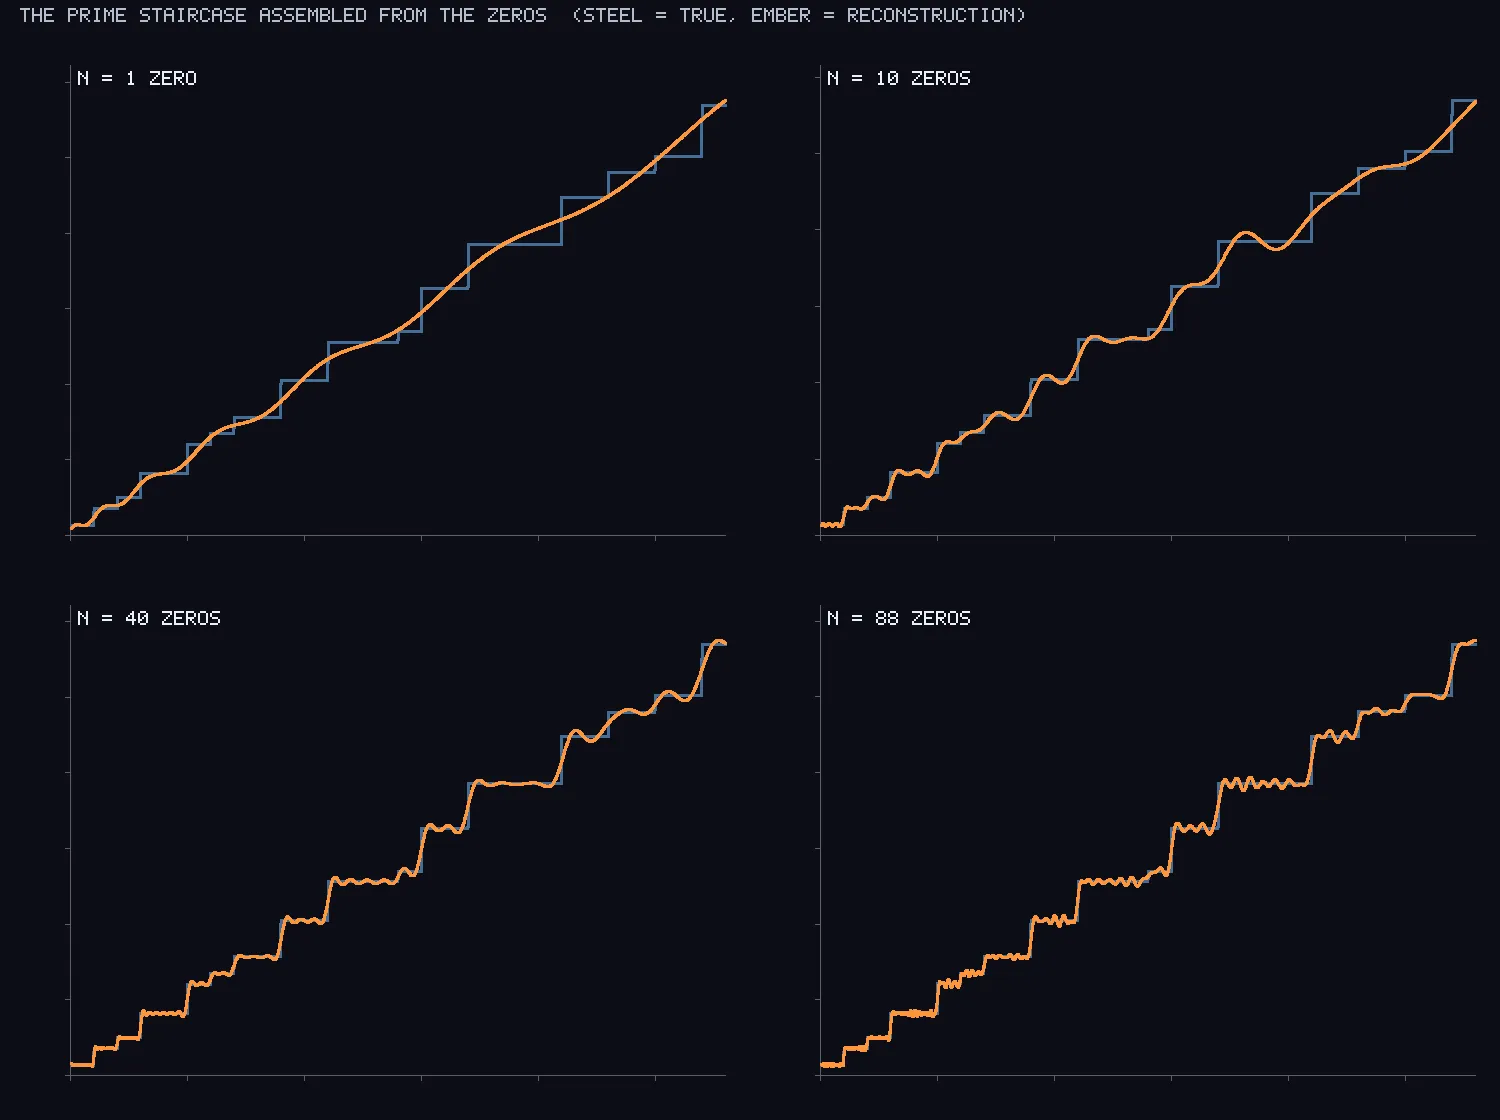
One wave gives you a gentle wobble around the average. By eighty-eight the steps are in the right places, the flat parts are flat, and the risers land on the primes.
The ripples still visible on the treads are not a mistake. That is what a finite number of waves always does at a sharp edge, and seeing it is how you know the reconstruction is honest rather than fitted.
The other thing this shows is that the low zeros do nearly all the work. Each wave’s size falls off as the height goes up, so the first one is louder than everything above it put together, and the rest are a shimmer. The order hiding in the primes is carried by a handful of low frequencies.
Then the same fact from the other direction
The reconstruction above uses the zeros to predict the primes. The reverse is the better test: use the primes, alone, and see if the zeros fall out.
So I sieved every prime below ten million, 664,579 of them, built the fluctuation from the sieve with no reference to any zero, and took its Fourier transform. If the formula is real, the spectrum should spike at the heights of the zeros.
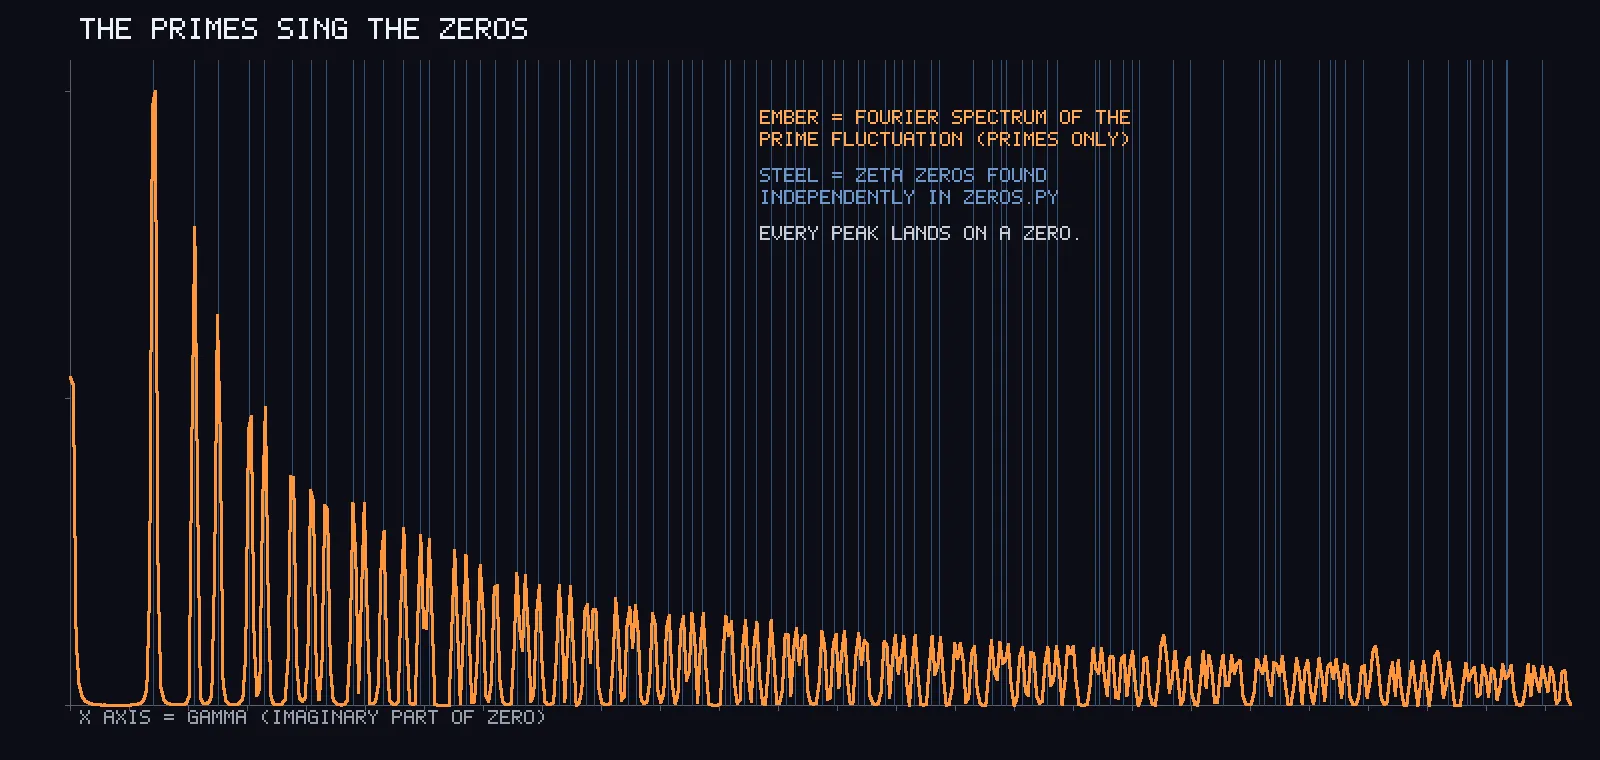
That is the plate as that night made it, and I am showing it unaltered because the left half and the right half say different things.
On the left, the blue lines sit on the orange peaks. On the right they drift off and end up in the gaps. At the time I read that as the high zeros getting faint and the resolution running out. It is not. My zero list is wrong up there.
Two months later I rebuilt the zeros a completely different way and checked both against a published table. The list I made that night holds 88 zeros below a height of 250, and there are 108. Twenty are missing, because I never counted my zeros against the formula that says how many there should be, which is one line and would have caught it immediately. And above a height of 150 the ones I did list are off by more than a whole gap between neighbours. They are not slightly wrong zeros, they are not zeros.
The night’s result survived the correction, because the claim only ever rested on the low ones. But the picture kept the evidence of the error in plain sight for two months, and it was visible the whole time to anyone who looked at the right-hand third of it.
The test it never ran
Here is the part that bothered me more, going back to it.
The night reported that twelve of the twelve lowest zeros were recovered from the primes, with a peak counted as a match if it sat within 0.5 of a zero. Where did 0.5 come from? I chose it. And the plate carries the sentence “every peak lands on a zero”, which is the claim running the other way and was never measured at all.
A match criterion you picked yourself, scoring a claim you wanted to be true, is not evidence until you know what it would have said about something false. So I ran it against decoys.
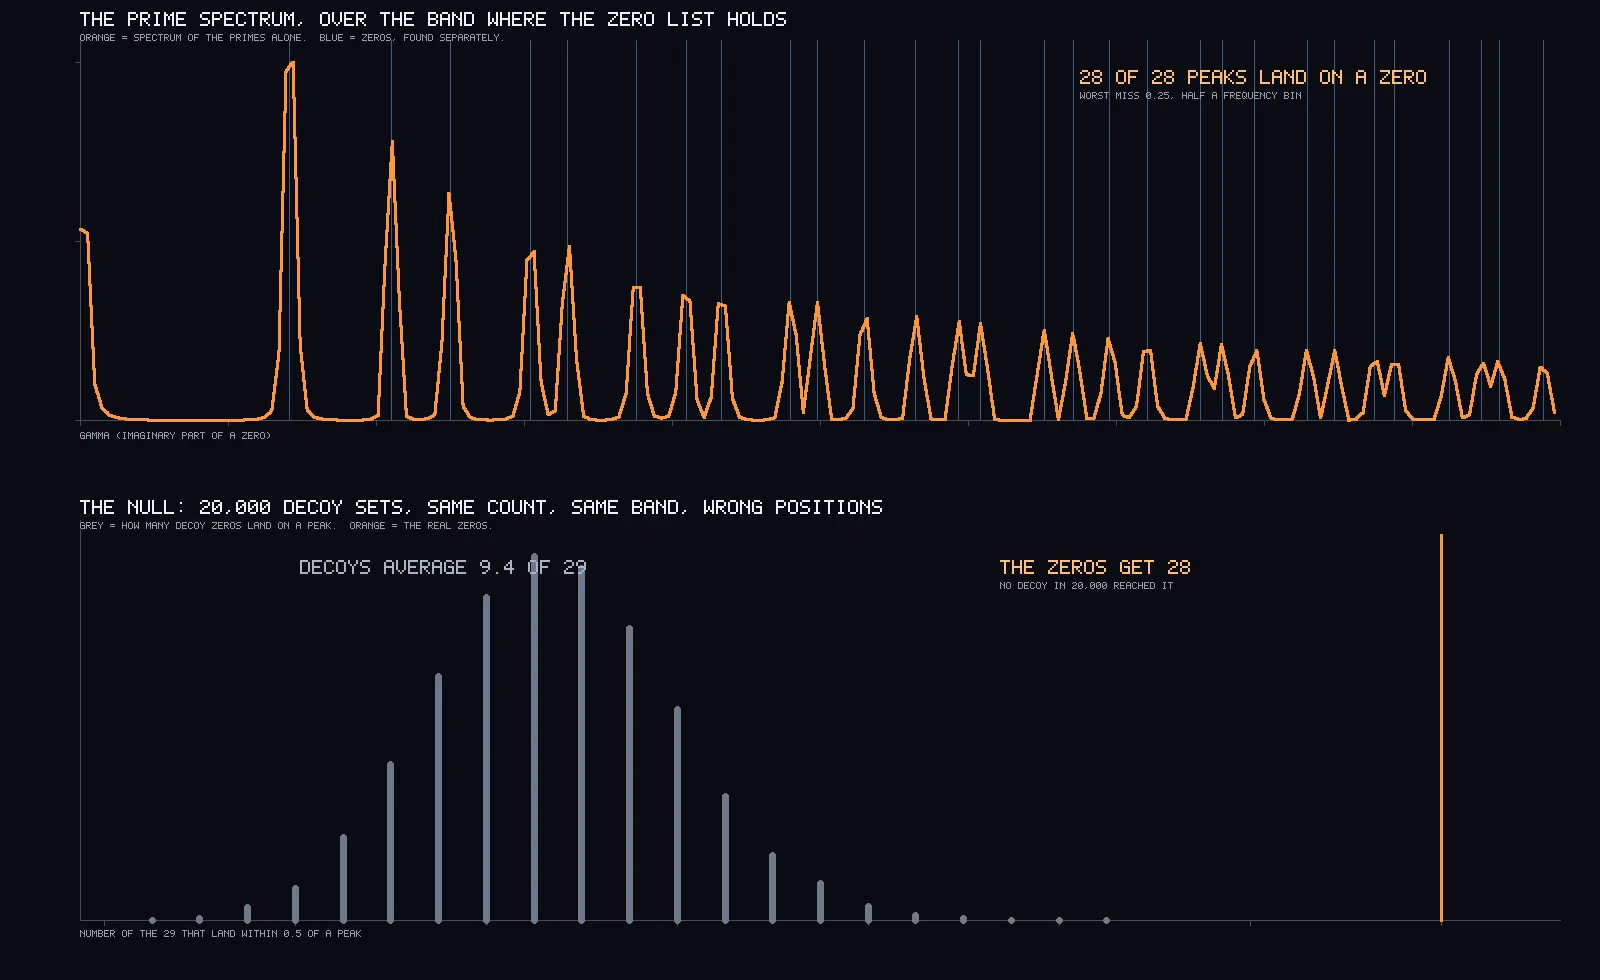
The band is cut at a height of 100, because that is where my zeros are trustworthy, and drawing the line there is the honest half of the result. Inside it there are 29 zeros and the primes produce 28 peaks.
All 28 peaks land on a zero. The worst of them is 0.25 away, and the average is 0.12.
28 of the 29 zeros find a peak. For the null, I made twenty thousand fake zero sets with the same number of entries spread over the same range, so only the positions are wrong, and scored them identically.
The decoys average 9.4 hits out of 29. The best single run out of twenty thousand got 21. None reached 28. Taking the real zeros and sliding them all along by half a typical gap drops them from 28 to 7.
So the tolerance is not doing the work. Only about a third of that range is within 0.5 of any peak at all, which means a single hit proves nothing and 28 of them is not something chance produces.
The one that got away, and why
One zero, at height 94.65, has no peak near it. That is worth explaining rather than rounding off.
It is not too faint. The signal there is well above the detection threshold. What it is, is too close to its neighbour. A Fourier transform cannot place a frequency more precisely than one bin, and my bin here is 0.48 wide, set by the length of the range I sieved over.
That is also the right way to read the whole result. The average miss of 0.12 is a third of one bin. The peaks are not approximately where the zeros are, they are as close as the measurement is able to place them.
The pair at 94.65 sits 2.55 bins apart, the tightest of any neighbouring pair in the range, and it is the only pair that failed to separate. The next tightest, at 2.89 bins, came through fine. So the limit sits somewhere between those two, which is about where two tones of similar strength stop being distinguishable under the window I used. I would rather state it as the bracket the measurement supports than quote the window’s nominal figure, which would have predicted the 2.89 pair to fail as well and it did not.
Then I widened it, because I had been wrong about why I could not
Everything above stops at a height of 100, because that is as far as my zero list from that night can be trusted. Writing that sentence, I checked the obvious way around it, and found I had been wrong about the obstacle.
I rebuilt the zeros a second time in August by a different method. I had assumed that method was poor at these low heights. It is not. Measured against the standard reference values it is accurate to about one part in a hundred thousand at the very first zero. That is thousands of times finer than the offsets I am measuring here. It also gets better as you go up, not worse.
So there was no obstacle. There was a sentence I had written and never checked.
With a verified list out to a height of 250 the test runs on 108 zeros instead of 29. I also ran the count this night should have run and never did: there is a formula that tells you how many zeros lie below a given height, and it says 107.65. I found 108.
| up to height | zeros | peaks | zeros that find a peak |
|---|---|---|---|
| 100 | 29 | 28 | 28, or 97% |
| 160 | 58 | 54 | 54, or 93% |
| 250 | 108 | 96 | 99, or 92% |
The success rate falls as you go up, and I predicted that before running it, along with the reason. Zeros get closer together the higher you go. The measurement has a fixed resolution. So the two have to collide somewhere.
That prediction is checkable one zero at a time rather than on average. Take all 108 and sort them by how close their nearest neighbour is, measured in units of the transform’s own resolution.
Every zero with more than 2.72 units of room found its peak. All 72 of them, no exceptions. Of the 36 that are packed tighter than that, 27 were still found. The most crowded zero that was found had 1.49 units of room, and the roomiest one that was missed had 2.63.
So the rule is one-directional, which is what I would expect. Enough space always works. Less than that sometimes works, because whether two nearby tones separate depends on their relative strength too, not only their spacing.
The decoys were run again at the wider band. They average 44 of 108, their best single run out of twenty thousand got 64, and none reached 99.
That changes what the honest headline is. Not 12 out of 12, which was the original claim on a hand-picked dozen. Not 28 out of 29. It is this: every zero this measurement has the resolution to see, it finds. Seventy-two out of seventy-two. The nine it misses are not a failure of the connection between primes and zeros. They are the price of having sieved a finite stretch of numbers.
Each zero gets a pure tone, entering one at a time, loudest at the bottom because that is how the formula weights them. The staircase sharpens by one wave with every note that joins.
What I came away with is a sharper sense of what these two objects are to each other. The zeros are not a tool for studying primes and the primes are not an illustration of the zeros. They are one thing written two ways, and if you compute either side hard enough the other side appears in it, down to where a measurement’s own resolution stops.