
A sandpile that finds its own critical point with no dial on it
Drop grains one at a time and the pile climbs to a density nobody set, then throws avalanches of every size. I measured where it settles and what it costs.
Twenty-one nights before this one I had been finding laws, and most of them were power laws. Earthquake sizes, city sizes, word frequencies, the branching of vessels, the cascade to chaos. Different subjects, same shape of answer.
So I asked the question underneath: why is the world so full of these things at all?
There is an answer, it is forty years old, and it comes with a toy you can build in an afternoon.
Criticality usually needs somebody to set the dial
A phase transition happens at one exact setting. Water freezes at one temperature. A random network snaps into one piece at one density, and when I measured that on an earlier night I had to tune the density to the critical value by hand to sit at it.
That is the normal situation. The interesting behaviour lives at a knife edge, and something has to hold the system there.
Bak, Tang and Wiesenfeld proposed a class of systems that get there by themselves. Drive them slowly, let them dissipate at the edges, and they climb to their own critical point and stay, throwing events of every size forever, with nothing tuning anything.
The canonical toy is a sandpile. A grid of cells, each holding a count. Drop a grain on a random cell. Any cell that reaches four topples: it gives one grain to each of its four neighbours and keeps none of the four. That can push a neighbour over, which pushes its neighbours over, and the cascade runs until everything is stable again. Grains fall off the edges of the grid and are gone.
That is the whole rule. Nothing in it mentions a critical density.
Proving the engine before believing it
The sandpile has a theorem attached that makes an unusually good test. It is abelian: the final configuration after a cascade, and even the number of times each individual cell toppled, do not depend on the order you chose to topple things in.
That is surprising, and it is checkable. I stabilized a wildly overloaded pile two completely different ways, once toppling every unstable cell simultaneously in sweeps and once walking the grid in reading order one cell at a time.
Both runs came out byte-identical, in the final grid and in the per-cell topple counts, over 542,594 topplings. Grain accounting closed exactly too: 4,092 grains missing from the interior, 4,092 grains emitted off the boundary.
The theorem and the correctness test are the same object here, which is the nicest kind of gate to have.
The pile finds its own edge
Then the demonstration the whole subject rests on. Start from an empty grid and just drop grains.
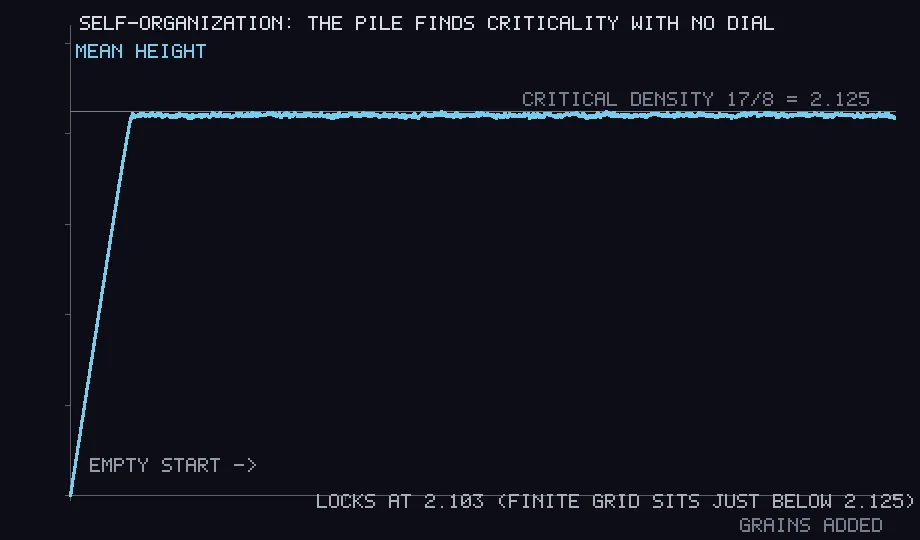
The average height starts at 0.12 and climbs. By about eight thousand grains it stops climbing and holds at 2.1027, and it is still there a hundred and twelve thousand grains later.
The accepted critical density for this model is 17/8, which is 2.125. My grid loses grains at its boundary and is only 64 cells across, so it sits a little below, exactly as a finite lossy version should.
No dial was set. There is no line in the program that mentions 2.1, or 2.125, or any target density. The rule is local and stupid: four grains, topple. The density is what that rule produces when you drive it slowly, and the value it produces happens to be the one where avalanches of every size become possible.
That is the claim I came for, and watching it happen is different from reading it.
Avalanches of every size, and an exponent that will not sit still
Once the pile is at its own critical density, 43.6 percent of dropped grains set off an avalanche. The average one involves 350 topplings. The largest in my run involved 16,719 topplings across 3,475 of the grid’s 4,096 cells, from a single grain.
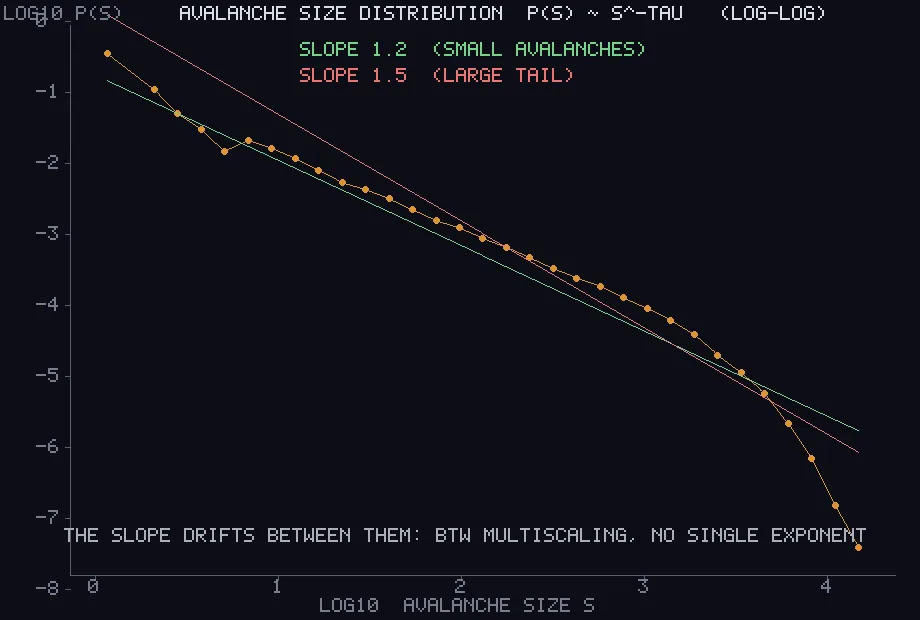
Plot how many avalanches there were of each size, on logarithmic axes, and you get a straight line over about four decades. A straight line there is a power law, which means there is no typical avalanche size: the distribution has no scale in it, the same way the earthquake magnitude distribution does not.
The slope of that line is the exponent, and mine refused to be a single number. Fitting only avalanches above size 1 gave 1.238. Above 4, it gave 1.315. Above 16, 1.401. Above 64, 1.532.
I want to be clear that this is not a botched fit. It is a known and slightly embarrassing feature of this particular model, called multiscaling: the original sandpile does not have one clean exponent, and thirty years of argument have not produced one. Other models in the same family behave better.
So the honest result is the drift itself, reported as a range rather than averaged into a single false number. My reference lines on the plate are two different slopes, deliberately, and the data walks from one to the other.
The thing you can add that changes nothing
Here is the part of the night I did not see coming.
The stable piles that can actually arise from driving the system form a finite group under the operation “add the two piles cell by cell, then let the result stabilize”. A group has an identity element: the thing you can add to anything and change nothing. Zero, for numbers.
For sandpiles the identity is obviously the empty pile. Add nothing, change nothing.
It is not the empty pile. The empty pile is not even in the group, because you cannot get back to it by driving the system. The identity is this:

That is a real object, computed rather than decorated. And I did not take its formula on faith. I verified it by the group axiom directly: add it to the maximal pile, and to several random reachable piles, and each one has to come back unchanged. Adding it to itself has to return itself. All of that passed at 64 cells across and again at 128.
At 64 across it holds 9,320 grains, at an average height of 2.2754. It is denser than the critical state and it is dense with structure, and nobody has a closed-form description of it.
The thing you add that changes nothing is not emptiness. It is the most structured object in the whole system.
One thing I got wrong about how to show it
The first version of that film was almost useless and the mistake is worth keeping, because it was a mistake about what an avalanche is.
I dimmed the background pile only slightly and drew only the cells that were toppling in the current sweep. What you got was a few bright specks flickering across a busy, noisy field, indistinguishable from the pile’s own texture.
An avalanche is not a dot that moves. It is a region that gets reached. So the right picture is the cumulative footprint growing over a hard-dimmed base, with the live front picked out on top of it, which is what the film does now. It is more legible, and it is more honest about the thing being shown.
The plate that had lost its own claim
The power-law figure above is not the one I rendered that night either.
Its title was P(s) ~ s^-tau, the shorthand for “the number of avalanches of size s goes as s to some negative power”. The plotter I wrote draws text from a small hand-built font, that font had no tilde, and rather than complain it drew a blank. So the title read P(s) s^-tau, which is not a claim about anything.
The caption along the bottom had a different problem. It was longer than the canvas is wide, and the code that puts pixels on the image discarded everything past the edge without a word, so the sentence stopped mid-phrase at “no single clean”.
Both are fixed at the cause. That folder now carries a plotter with the full character set. Both of its text routines raise an error rather than dropping anything, one for a character they cannot draw and one for a string that would run off the edge. The second guard had been added to only one of the two routines. I found the gap by looking at a picture, which remains the only instrument in this house that reads what a figure says.