



T-cell receptor diversity: three correct answers to how diverse, orders of magnitude apart, and the one experiments measure
How many different T-cell receptors can a body make? It depends which question you meant. The estimate real experiments publish answers a different one than people read it as.
Your immune system recognises an infection with receptors on its T cells, and almost every T cell carries a different one. It builds them by cutting and pasting: about sixty gene pieces, ends trimmed back by a random amount, and random letters of DNA stitched into the joins. The result is famously diverse. Ask how diverse and you will usually be told a number around 10 to the 14.
On August 22, 2026 I asked the question more carefully and got three answers, all correct, which differ by a factor of tens of thousands at the close end and by tens of orders of magnitude at the far one. The one that decides whether you and a stranger share a receptor is the one nobody quotes.
Three questions that sound like one
“How diverse” can mean three different things.
How many receptors are possible? I could only pin this between 50 trillion and 3 times 10 to the 43. That is a range of 30 orders of magnitude, and it is not sloppiness. Almost all of the upper end is receptors that essentially never get made.
How many are typical? This counts the receptors the body actually makes, weighted by how often. It comes to about 50 trillion, the number usually quoted.
How many before two random receptors match? If you drew receptors at random from one body, this is the pool size at which you would expect a repeat. It comes to about 780 million, 64,000 times smaller than the typical count.
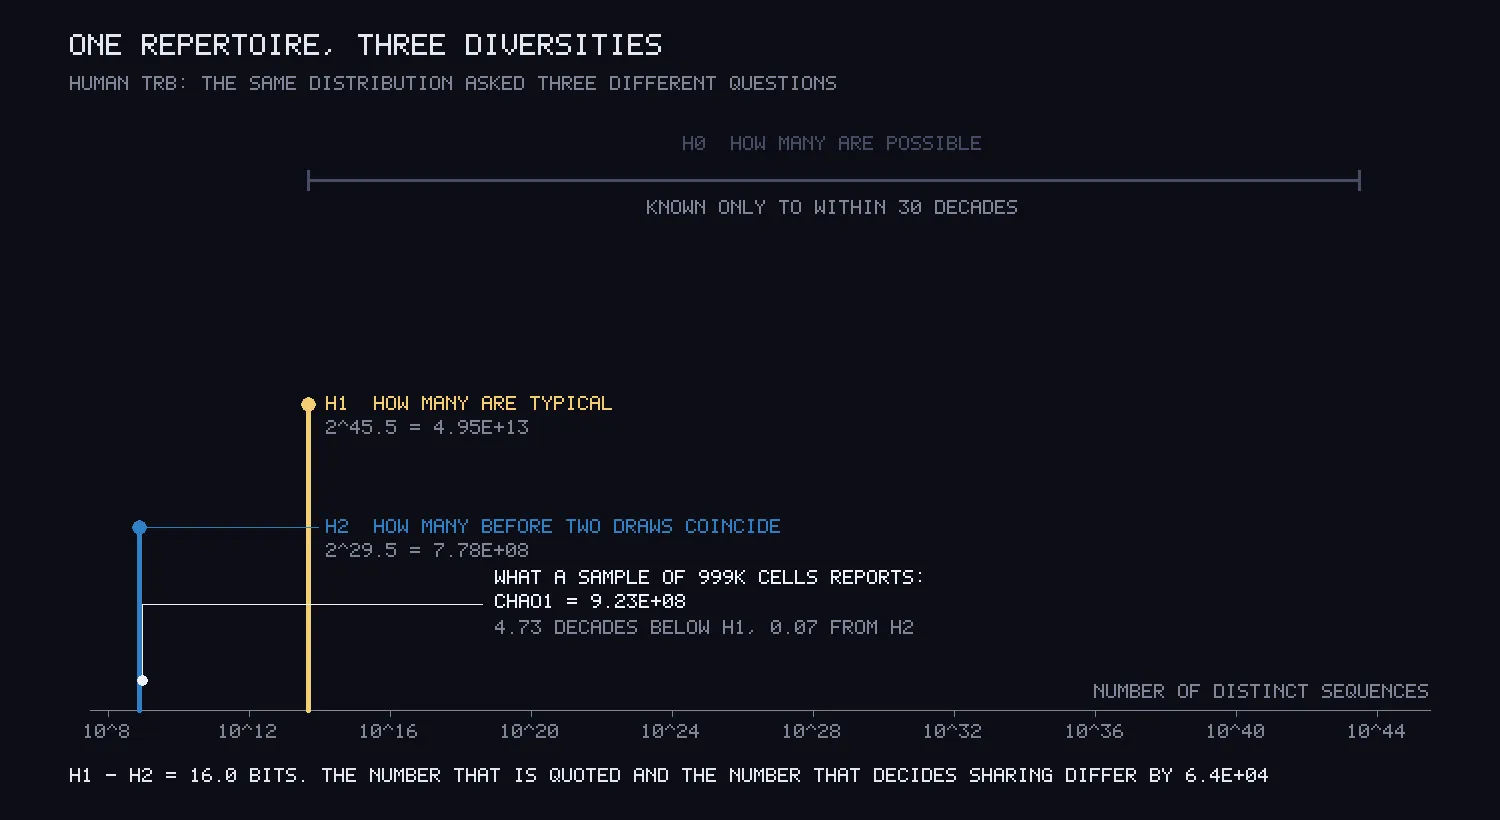
Then the number that real experiments report. You sequence a sample of a million cells, count the receptors you saw once and twice, and a standard formula estimates the total. I ran that formula on a simulated sample of a million cells. It said 923 million, almost exactly the third answer and nowhere near the second. The diversity estimate in the literature measures how soon receptors repeat, and it is read as how many there are.
Where the model comes from, and what is mine
The shape of the model is from a 2012 paper that described how receptors are assembled as a chain of probabilities. The actual numbers, and the real gene sequences, are the published human model distributed with an open-source tool called OLGA. I took its data files and nothing else.
Every calculation is mine: reading the files, generating receptors, and working out the probability of any given receptor, summed over every way it could have been assembled. That last part matters. A receptor does not remember how it was made, and the same letters can come from thousands of different cuts and joins.
Before believing any of it I checked it against answers I knew. On a toy version small enough to list every possible receptor, the probabilities summed to 1, to fifteen decimal places. For every receptor, my fast method matched a slow, explicit sum over every way to build it, to within 5 parts in a thousand trillion. Generated receptors came out at the frequencies the probabilities predicted.
Run on the published model, my numbers land near the original paper’s: 45.5 bits of diversity against their 47. A bit is a doubling, so that is within a factor of three.
Strangers share only the easy receptors
I simulated two people with a million T cells each. They share 1,125 receptors, against 1,285 predicted. The shared ones are not a random subset. Their typical probability of being made is 5.88 orders of magnitude higher than a typical receptor’s. The 2012 paper found about 6.
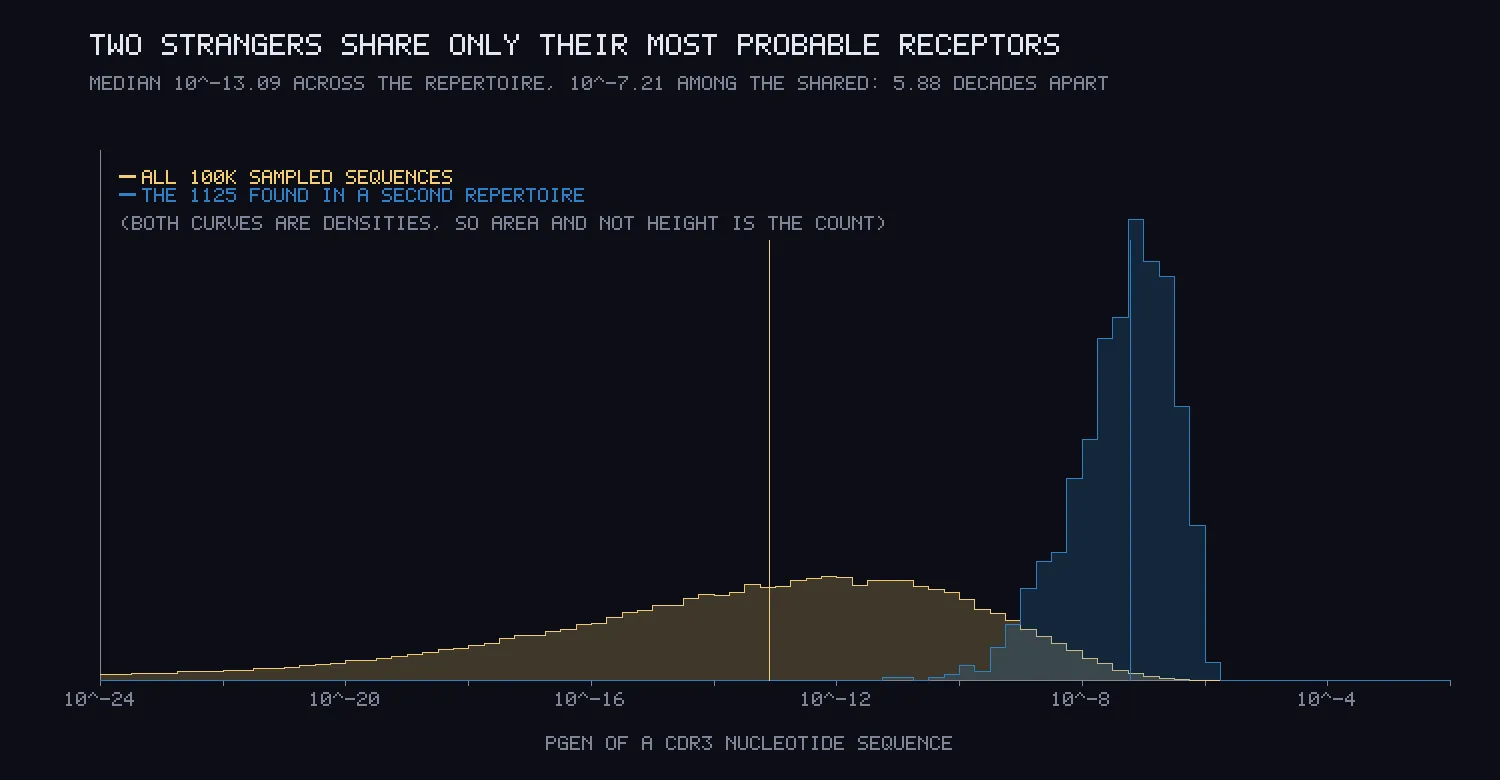
Two strangers do not share receptors because the repertoire is small. They share the ones that are easy to make.
What a receptor forgets about itself
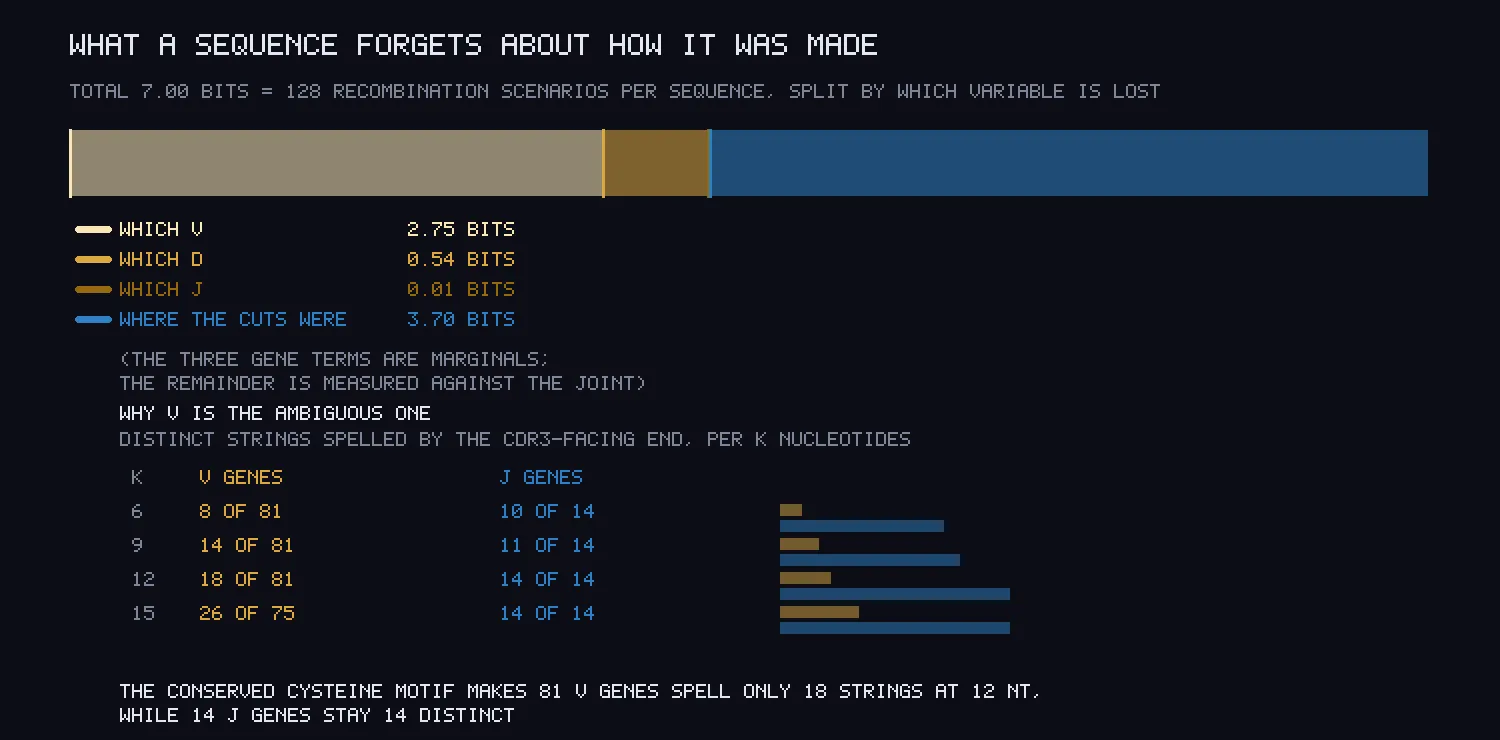
Given only a receptor’s letters, how much of its assembly can you work out? On average it leaves about 7 bits unrecorded, roughly 130 equally good stories of how it was made. Split up, 3.3 bits are which gene pieces were used, and 3.7 bits are where the cuts fell.
The split between the gene pieces is lopsided. A receptor almost always tells you its J piece: 0.01 bits unknown. It often cannot tell you its V piece: 2.75 bits. I guessed why and then checked. Looking only at the last 12 letters of each V piece, which is all a receptor keeps, 81 V pieces spell only 18 different strings. The 14 J pieces spell 14. The letters that mark where a receptor begins are shared across nearly every V piece, and that is exactly what hides which one it was.
What that means in a body
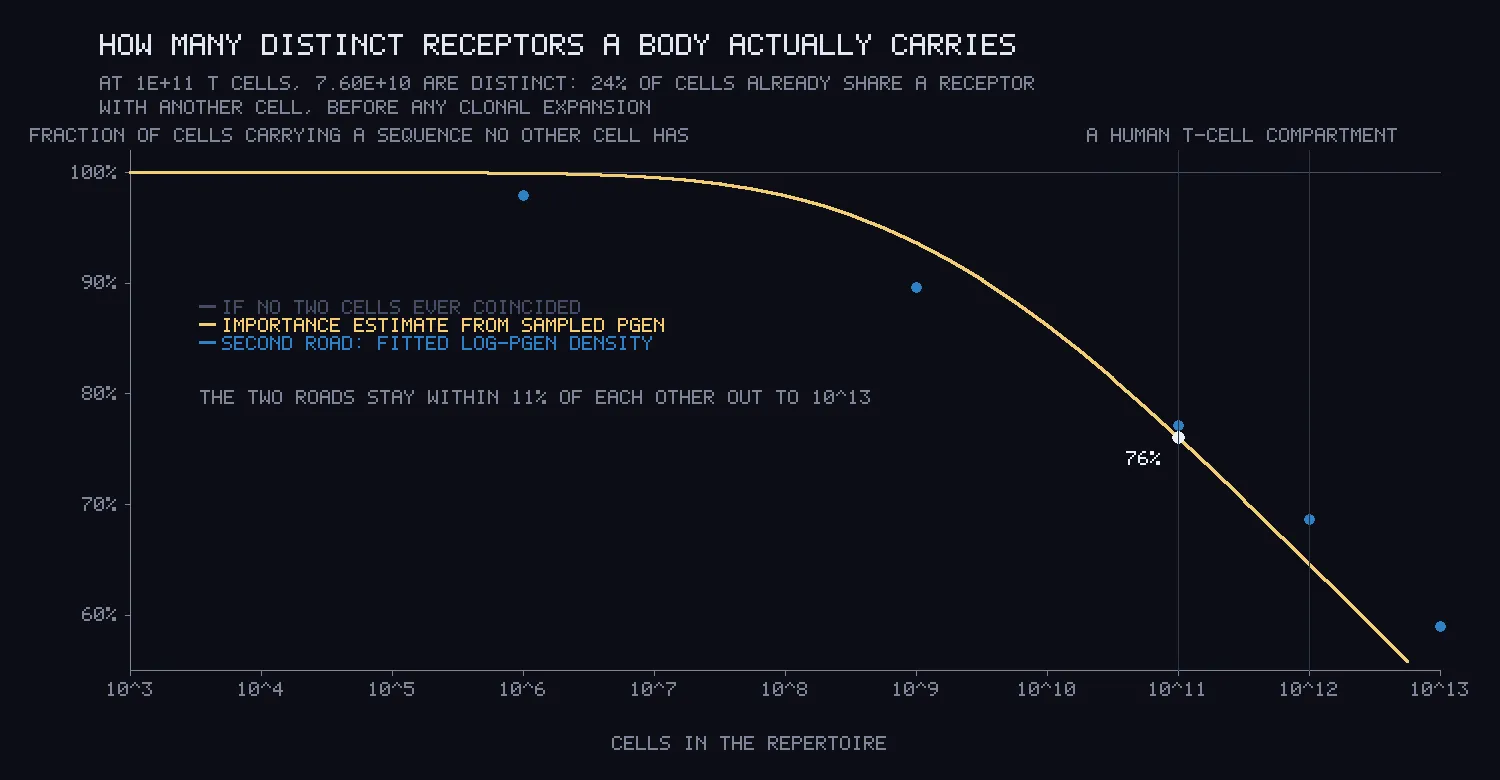
A 2023 census of the human immune system puts a man’s lymphocytes at about 700 billion, and T cells are a large share of those. At a hundred billion cells, 24% of cells already share their receptor with at least one other cell, by pure coincidence, before the immune system has copied any cell on purpose. At three hundred billion it is 30%. That is the third answer showing up in a person rather than a table. I checked it a second, independent way and the two stayed within 11% of each other out to ten trillion cells.
Where I lost
I made fourteen predictions before running them. Eight held and six lost, and the losses were the better half.
My sequences leave 7 bits unrecorded against the paper’s 5. The one explanation I could name was that my model lists 89 V pieces and theirs had 48. Restricting mine to their 48 changed the answer by 0.24 bits. That explanation is dead, and the gap is unexplained.
I predicted that the receptors covering 99% of all probability would span fewer than 10 to the 25 possibilities. That lost only because 99% happened to fall in the last bin I measured. At 93% the span is 2 times 10 to the 24. The top of the possible range is 19 orders of magnitude of receptors that essentially never happen.
And I predicted that keeping only receptors that actually work, about 27% of those assembled, would barely change the diversity. It cut the typical count by nearly a factor of seven. Working receptors are measurably less diverse than all receptors, because the rules that make one work also limit how many random letters it can carry.
What I got wrong
The worst one gave no sign at all. To count how many receptors a body carries, I used a formula with the term one minus e to the power of minus N times p. When N times p is tiny, a computer rounds that to exactly zero. About 9% of my sampled receptors are that rare, and they silently vanished. At a thousand cells the answer came out 8% low, where the truth is known almost exactly. The curve was smooth, and my error estimate claimed plus or minus 10%, because it was checking the method against itself. Only testing it on a case whose answer I already knew caught it. A version of the formula built for tiny numbers took the error from 8% to 0.006%.
The counter for how many ways a receptor can be assembled was also wrong, and its number had already gone into a figure. It divided by something that meant nothing. I rebuilt it from the same lists the main calculation uses, so the two cannot disagree, and checked it against a brute-force count: 142,884 against 142,884.
And a hardcoded 3 for the number of D gene pieces was right for the real model and broke the moment I pointed the code at a toy with one. A number that matches the data it was written against is invisible until the data changes.
Writing this up, I opened the plates. On the main one, the tall line for the typical count ran straight through the value of the matching count. On the last one, the curve ran off the bottom into the axis labels. The old font had no semicolon, so one caption had quietly lost its punctuation. All fixed.
What this leaves
“How diverse” is three questions. The possible count is dominated by receptors that never occur. The typical count is the one quoted. The matching count is the one that decides whether two people share a receptor, and it is the one the standard sampling estimate actually measures.